Maritime Vessel Intelligence is a browser-based simulation platform that monitors fleets of up to 10,000 vessels in real time, detecting behavioral anomalies such as AIS transponder blackouts, course reversals, and suspicious stops using a weighted multi-signal risk scoring engine. Built entirely client-side with React, TypeScript, Tailwind CSS, and Mapbox GL JS, it demonstrates production-grade performance optimization through TypedArray-backed O(n) tick pipelines and ring-buffer windowed detection — all without a backend or Web Workers.
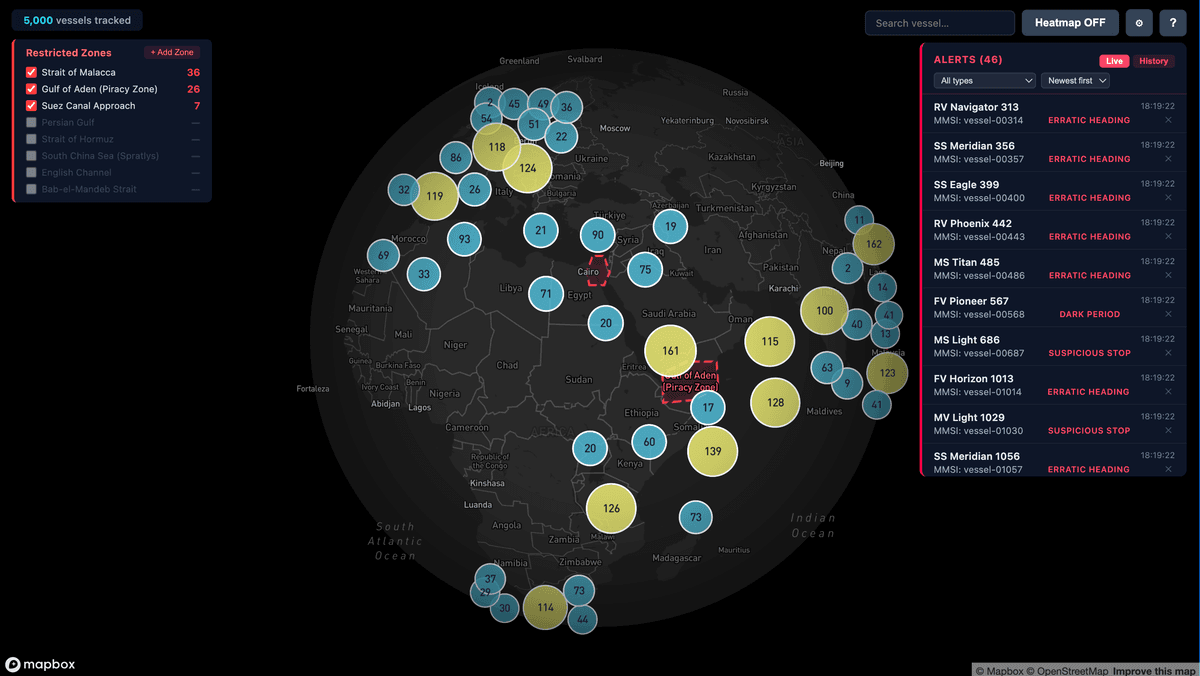
Maritime Vessel Intelligence is a real-time fleet monitoring and anomaly detection platform that runs entirely in the browser. It simulates large-scale maritime vessel fleets — up to 10,000 ships simultaneously — and applies behavioral analysis algorithms to identify suspicious activity, compute dynamic risk scores, and visualize the results on an interactive global map. The project demonstrates the kind of systems used by maritime authorities and fleet operators for tools like LRIT (Long Range Identification and Tracking) and SafeSeaNet.
Maritime security agencies and fleet operators need to monitor hundreds or thousands of vessels simultaneously, identifying potentially illicit behavior such as transponder shutdowns (going "AIS dark"), erratic maneuvering in restricted straits, or suspicious stops in sensitive geopolitical zones. Building and testing such a system typically requires expensive AIS data feeds and backend infrastructure. The goal here was to create a realistic, self-contained simulation that could demonstrate the full detection and visualization pipeline — with no backend, no live data dependency, and fully interactive.
The application is built as a layered client-side architecture with strict separation between the simulation engine, detection logic, map rendering, and UI:
| Technology | Role |
|---|---|
| React 19 | UI component tree (alerts, zone HUD, config panel, info panel) |
| TypeScript 5 (strict) | Type safety across engine, detection, and map layers |
| Vite 7 | Fast dev server and production bundler |
| Tailwind CSS | Utility-first styling for all UI components |
| Mapbox GL JS 3 | Interactive vector tile map, clustering, heatmaps, GeoJSON layers |
| TypedArrays | O(n) vessel state storage (Float64Array for coords/speeds, Uint8Array for flags) |
| Vitest | Unit tests for anomaly detection, risk scoring, zone containment |
TypedArrays were chosen specifically over plain JS objects to avoid garbage collection pressure at 10,000 vessels. Mapbox GL JS was chosen for its support for data-driven styling expressions, enabling risk-score-based color and size interpolation directly in the GPU render pipeline. Tailwind CSS was chosen to keep component markup self-contained and eliminate the overhead of maintaining separate stylesheet files.
Performance at scale without Web Workers Running a full physics + detection + scoring pipeline for 10,000 vessels on the main thread every 2 seconds is inherently risky for frame drops. This was solved by pre-allocating all typed buffers at engine initialization and mutating them in-place each tick — eliminating the GC churn that would otherwise come from creating new vessel objects. The result is a consistently sub-millisecond tick loop for fleets up to 5,000 vessels.
Windowed anomaly detection without dependencies Detecting "erratic heading" requires comparing heading values over a 10-second sliding window, not just instantaneous state. Rather than reaching for a library, a manual ring buffer pattern using modulo indexing was implemented — O(1) per vessel, O(n) total, with no additional allocation.
Zone intrusion at scale Ray-casting point-in-polygon checks for 8–20 geopolitical zones against up to 10,000 vessels could become a bottleneck. Bounding-box pre-rejection eliminates most checks before the more expensive ray-cast runs, keeping zone detection within the O(n) budget.
Mapbox GL JS v3 breaking changes The upgrade to Mapbox GL JS v3 dropped support for SVG-based custom marker rendering mid-development. All vessel icons were migrated to circle layers with data-driven expressions for color, radius, and opacity — which ultimately produced cleaner visual results and better clustering behavior than the SVG approach.