Asteroid NeoStats is a real-time near-Earth object tracking dashboard built with Vue 3 and powered by NASA's NeoWs API, allowing users to explore asteroid proximity, velocity, hazard status, and size across any 7-day date range. The project demonstrates full-stack frontend thinking — from API integration and data normalization to interactive data visualization and a polished space-themed UI — resulting in a compelling, production-quality portfolio piece that showcases both technical depth and design sensibility.
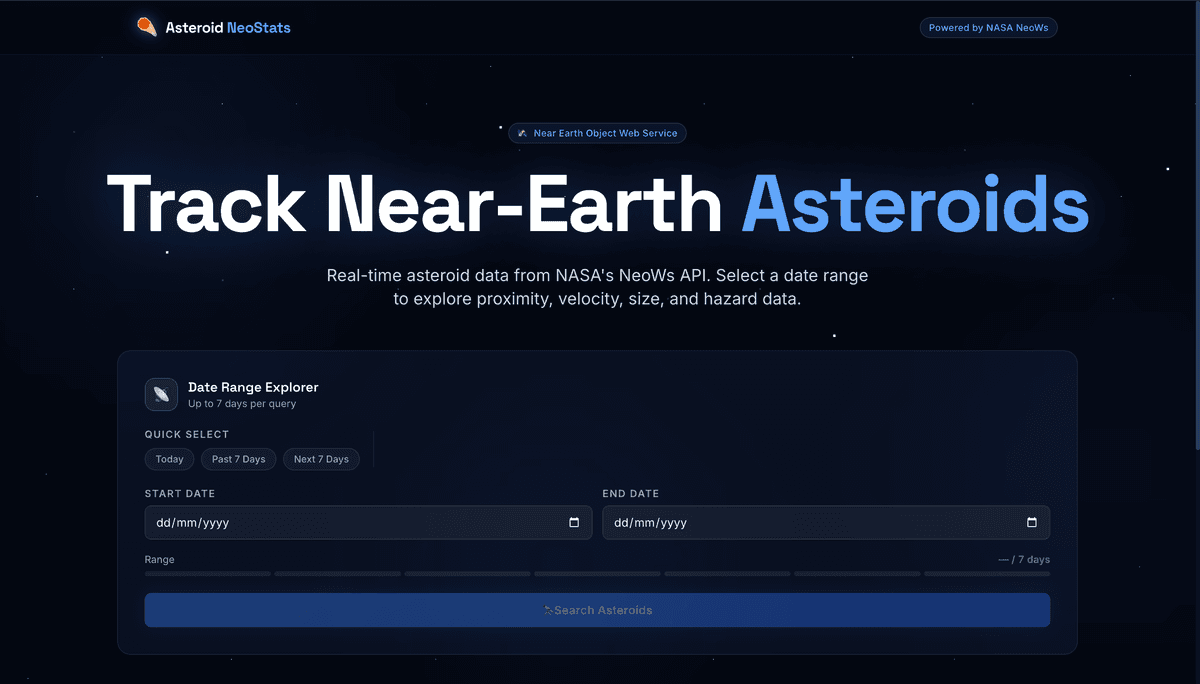
Asteroid NeoStats is a real-time web application that tracks near-Earth asteroids using NASA's NeoWs (Near Earth Object Web Service) API. Users select any 7-day date window to instantly pull live asteroid data and explore it through summary statistics, an interactive proximity timeline chart, and a sortable, filterable asteroid catalog — all wrapped in a deep-space UI with glass morphism cards and an animated CSS starfield.
Asteroid data from NASA is publicly available but presented in dense, developer-oriented JSON responses. There was no lightweight, visual tool that let a curious user — student, space enthusiast, or developer — quickly answer questions like: How many asteroids passed close to Earth this week? Which one was most dangerous? How fast was the closest approach?
The goal was to bridge that gap: turn raw NASA API data into an intuitive, visually engaging experience without requiring any astronomy background.
The app follows a form-driven single-page architecture. The user picks a date range via a
custom DatePicker component that enforces NASA's 7-day query limit with real-time
validation and visual feedback. On submit, a single Axios call fetches the full dataset,
which is then normalized in one pass inside App.vue:
calculateStats() — iterates the nested date-keyed response once, computing the
fastest, closest, and largest asteroid, plus hazardous and total counts.prepareChartData() — reshapes data into two Chart.js datasets (all asteroids vs.
potentially hazardous) grouped by date.asteroids array — flattens the nested structure into a table-ready format with
enriched fields (lunar distance, size in meters, approach date).All state lives in App.vue using Vue 3 Composition API. Child components are purely
presentational, receiving props and emitting events — no global state library needed for
this scope.
| Technology | Role |
|---|---|
| Vue 3 (Composition API) | Component framework; <script setup> SFCs keep components concise |
| Vite | Fast dev server and optimized production build |
| Tailwind CSS | Utility-first styling; custom CSS extends it with glass morphism and starfield animations |
| Chart.js + vue-chartjs | Reactive line chart for the proximity timeline |
| Axios | HTTP client with a configured instance injecting the NASA API key via .env |
| NASA NeoWs API | Sole data source — free public REST API returning near-Earth object data |
| Google Fonts (Space Grotesk + Inter) | Display and body typography suited to a space aesthetic |
Vue 3 was chosen for its Composition API, which makes co-locating data-fetching logic and derived state clean without reaching for a full state manager. Vite provides near-instant HMR during development. Tailwind enabled rapid UI iteration without fighting a component library's design opinions.
1. One-pass data normalization NASA's API returns a deeply nested object keyed by date, each containing arrays of asteroid objects. Computing six different statistics (total count, hazardous count, fastest speed, closest miss, largest size, average diameter) while simultaneously building chart and table data required a careful single-pass algorithm to avoid multiple O(n) iterations over potentially hundreds of objects.
2. 7-day API constraint with UX-friendly validation
The NeoWs API rejects ranges longer than 7 days. Rather than failing silently after
submission, the DatePicker validates the window in real time — showing a visual bar
indicator of the selected range, disabling invalid end dates, and providing one-click
presets (Today, Past 7 Days, Next 7 Days) to guide users naturally within the constraint.
3. Performant table rendering On large date ranges, the asteroid catalog can contain several hundred rows. Client-side pagination (configurable at 5/10/20 rows), sorting, and filtering via computed properties keep the DOM lean. A custom ellipsis-aware page number algorithm prevents rendering dozens of pagination buttons for large datasets.
4. Starfield background in pure CSS
A hardware-accelerated CSS starfield uses three fixed-position layers with box-shadow
arrays defining 100+ star positions at varying sizes, each with staggered @keyframes
twinkle animations (8–17 s cycles). Using pointer-events: none and fixed positioning
ensures zero layout or paint overhead.
5. Glass morphism on a dark background
Standard glassmorphism recipes assume a light or colorful background. On near-black
(#030712), contrast disappears. The solution uses very low-opacity fills
(rgba(255,255,255,0.035)), an aggressive backdrop-filter: blur(18px) saturate(180%),
and hairline borders (rgba(255,255,255,0.07)) to create depth without washing out the
starfield.